| Invariant Mass Distribution of Jet Pairs Produced in Association with a W boson in proton-antiproton Collisions at sqrt(s) = 1.96 TeV |
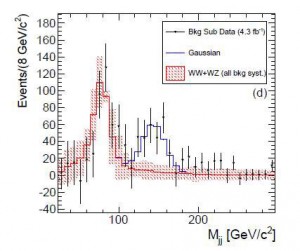 |
The di-jet invariant mass distribution for candidate events selected in an analysis of W+2 jet events. The black points represent the data. The red line plots the expected Standard Model background shape based on Monte Carlo modeling. The red shading shows the systematic and statistical uncertainty on this background shape. The blue histogram is the Gaussian fit to the unexpected peak centered at 144 GeV/c2. See:
Fermilab’s data peak that causes excitement |
Dialogos of Eide