 |
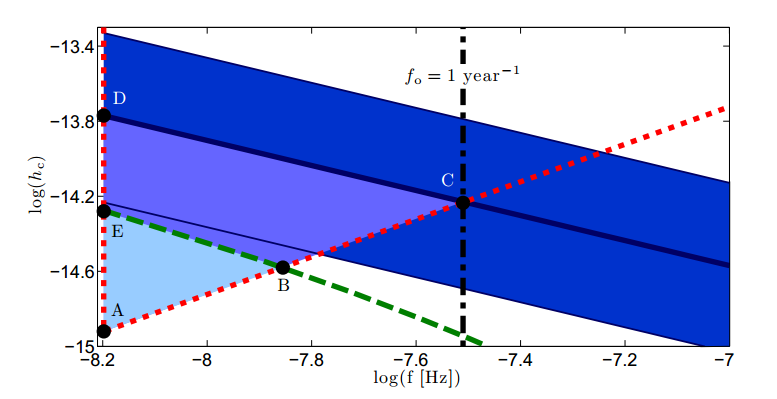
| Figure 1: Gravitational wave strain and strain sensitivity for a 5 year observation with PTAs. The red dashed line is the approximate strain sensitivity for current PTAs (11), and the green dashed line shows the previous estimate for the stochastic signal strength that is currently in standard use for PTA analyses (13, 14). The dark blue solid line corresponds to our mean estimate for the stochastic signal strength, with the blue shaded region bound by thin solid blue lines showing our 95% confidence interval for this estimate, based on the observational uncertainties of our model parameters. The light blue (△ACD) and cyan (△ABE) shaded regions show the area corresponding to the square root of the 2 integrand, to be integrated over logarithmic frequency intervals as in Eq. (3), for our expected SNR of 8, and the SNR of 2 expected from previous estimates (13, 14), respectively. See: The Imminent Detection Of Gravitational Waves From Massive Black-Hole Binaries With Pulsar Timing Arrays |
As mentioned in article by Technology Review the idea of previous information as to supplying data would have to be identified in future experiments as confirmations. In this instance information gained from Taylor and Hulse in terms of binary star rotations closeness.